
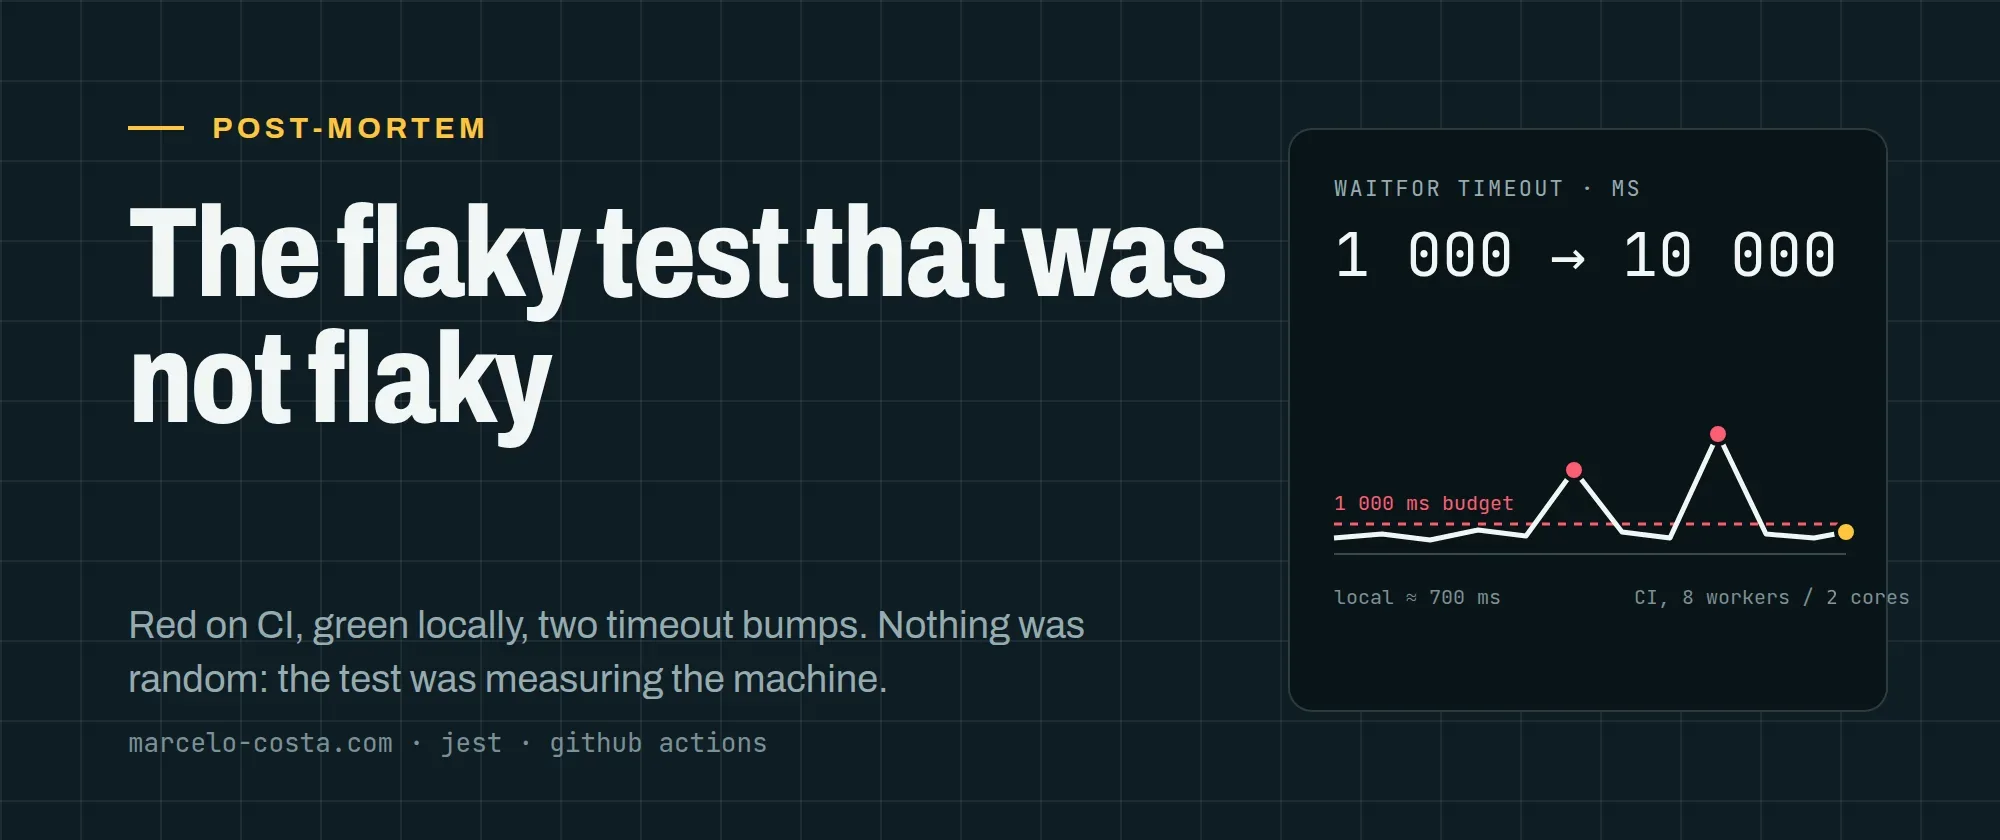
Confession time: this September I watched this website's own repository do the exact thing I have watched teams do with much bigger suites.
Red on CI → green locally → timeout raised → red again → timeout raised again.
(Yes, a Lead QA Engineer's own CI. I know.) The test is small and its results are public, which makes for a clean post-mortem (and a hard one to hide from). The Test Results page now tracks suite duration per deploy partly because of it.
So, date by date, here is how it went:
Red, green, red again
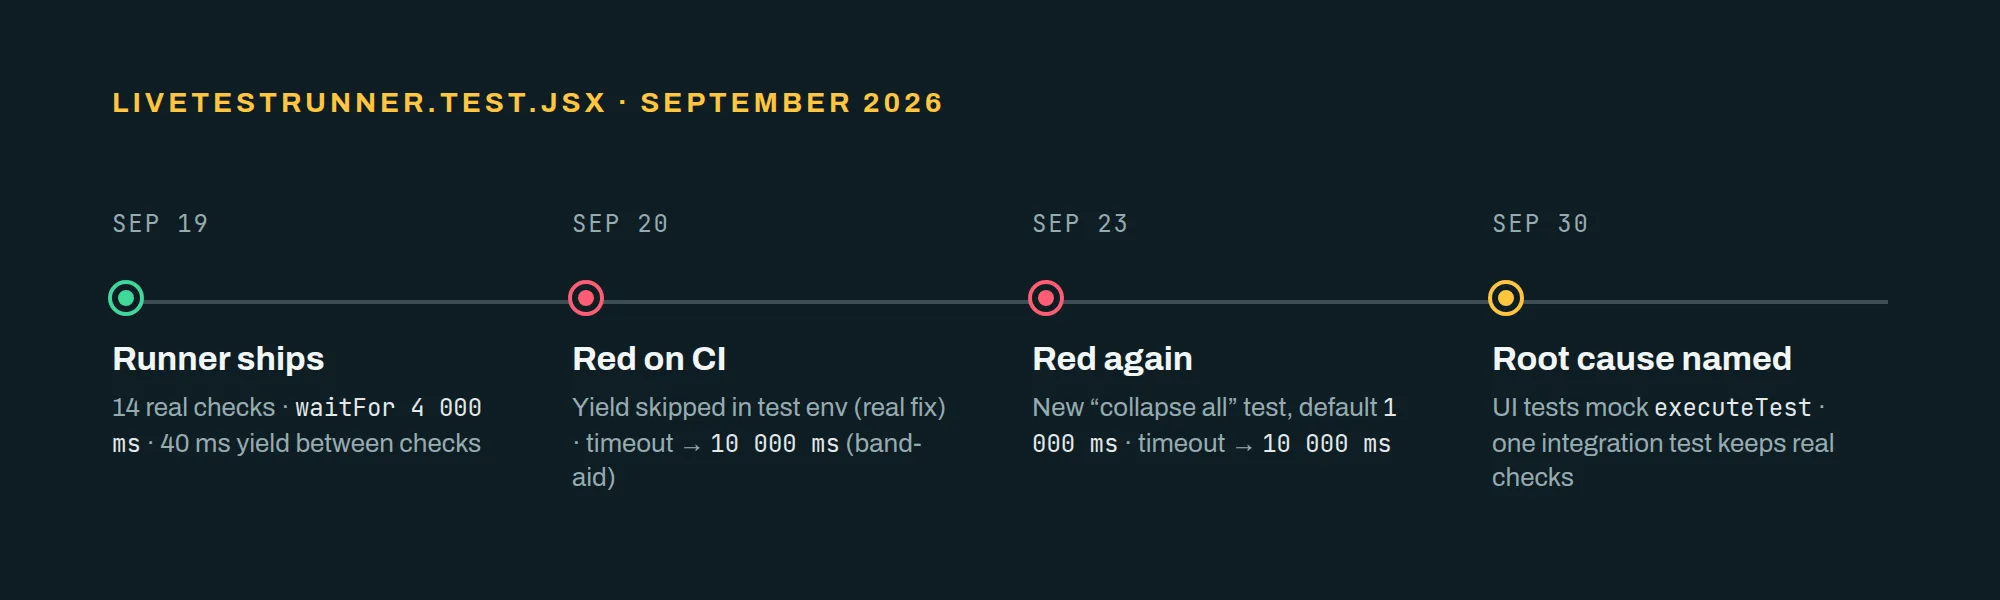
19 September. The in-browser test runner ships. It's the widget at the top of the Test Results page: fourteen real checks against the live DOM, i18n, network and timing. Its Jest test clicks "Run all" and waits for the completed state with a 4-second timeout.
20 September. The test fails on GitHub Actions. Locally? About 700 ms. The fix: the runner's 40 ms yield between checks is skipped when NODE_ENV is test, and the timeout goes to 10 seconds.
23 September. A new feature adds "collapse all" after a run, with a new test. It waits for the rerun button using Testing Library's default 1-second timeout. Red on CI the same morning. The fix: timeout to 10 seconds. (Seeing a pattern yet?)
30 September. This post, and the change described below.
Flaky is the wrong word
Every failure had the same shape. The assertion was correct. The component was correct. The test simply hadn't finished doing what it was waiting for when the clock ran out.
"Flaky" is the word everyone reaches for here, and it's the wrong one, because nothing was random. The work was deterministic. Only its duration varied.
Where the time went ⏱️
The test waited on the wall-clock time of real work.
The runner doesn't mock anything. Its fourteen checks walk the DOM, fetch a static asset, resolve a sample of i18n keys for the active language, and wait for a requestAnimationFrame tick. Inside jsdom on a laptop, that costs a few hundred milliseconds. Inside jsdom on a shared CI runner, it costs whatever the scheduler decides.
Two things made the scheduler's decision worse:
- The runner slept on purpose. Fourteen checks times a 40 ms UI yield is 560 ms of every run spent doing nothing, on top of the checks themselves. That was fixed on the 20th, and it was a real fix, not a mitigation.
- Jest was oversubscribed. The config sets
maxWorkers: 8. The hosted runner has 2 vCPUs. Eight workers on two cores → every suite gets a fraction of a core, exactly when the runner test needs a whole one.
Neither of these is a bug in the test's logic. Both are the test measuring the machine.
Why the timeout bump felt like a fix
So why did it feel fixed? Because the red went away. And because 10 seconds is so far above the 700 ms baseline that it looked generous rather than blind.
But a timeout is a measurement, not a fix. Going from 1 s to 10 s says: "this thing can be ten times slower than I thought and I do not know why." Nobody wrote that sentence down, so nobody asked the follow-up question. Three days later, a second test hit the same wall.
Two jobs, one test file
The runner component has two jobs, and the tests were mixing them up:
- Does the runner run real checks correctly? That's an integration concern. One test should own it, run the real checks, and be allowed to take its time.
- Does the UI react correctly to a completed run? Collapse all, expand all, rerun button, status pill. None of this depends on which checks ran or how long they took.
The UI tests now mock executeTest to resolve instantly with a passing result. They run in milliseconds locally and no longer depend on what the checks do. The one integration test keeps the real checks and keeps its long timeout, which is now honest: it's the only test whose job is to wait for real work.
import { executeTest } from '../utils/inBrowserTestRunner';

jest.mock('../utils/inBrowserTestRunner', () => {
  const actual = jest.requireActual('../utils/inBrowserTestRunner');
  return { ...actual, executeTest: jest.fn(actual.executeTest) };
});

const instantPass = async () => ({ status: 'passed', duration: 1, message: null, error: null });

test('offers collapse all after a run, then expand all again', async () => {
  executeTest.mockImplementation(instantPass);
  render(<LiveTestRunner />);
  fireEvent.click(screen.getByRole('button', { name: 'testDashboard.runner.runAll' }));
  await waitFor(() => {
    expect(screen.getByText('testDashboard.runner.rerun')).toBeInTheDocument();
  });
  // ...
});
Basically, instantPass turns every check into an instant pass.
Done, then? Not quite. That change also dropped the 10-second timeout from this test's waitFor, and CI went red on that same push. On this test. With every check resolving instantly! The catch: a run is still fourteen sequential steps, each a timer hop and a re-render, and on a contended runner that crossed the 1-second default. The 10 seconds went back in ten minutes later.
So the test no longer waits on real work, but until the first follow-up below lands, it still measures the machine.
What I'd do differently
Mostly, pick better words earlier. "Slow under CPU contention" leads somewhere; "flaky" leads to a retry button. And treat a timeout bump as a question: if a test needs ten times its local duration, write down why before merging. If you can't, you haven't found the cause.
I'd also separate the slow integration test from the fast behaviour tests on day one (the runner test file had four tests waiting on real work when two needed to), and record durations. The Test Results page now keeps suite time per deploy in its history; a trend line would have shown the CI floor drifting up long before a single test crossed it.
Still open
Two follow-ups stayed out of this change:
- Cap
maxWorkersat 50% so CI stops fighting itself. Left out on purpose: it affects every suite and deserves its own measurement. - Make the integration test blame the right thing. The runner's
requestAnimationFramecheck fails above 200 ms. Under contention that's a legitimate failure of the environment, not the site, and the integration test should say so in its message.
Where that leaves things: UI tests that run in milliseconds locally, one integration test whose long timeout is now honest, and a 10-second waitFor I can finally explain. Small repository, small test, same lesson as the four-hour suites: the expensive mistake is debugging a test that was never wrong.
What about you? What's the biggest timeout you've bumped before knowing what it measured? Leave me a comment, I'd love to hear the number!