
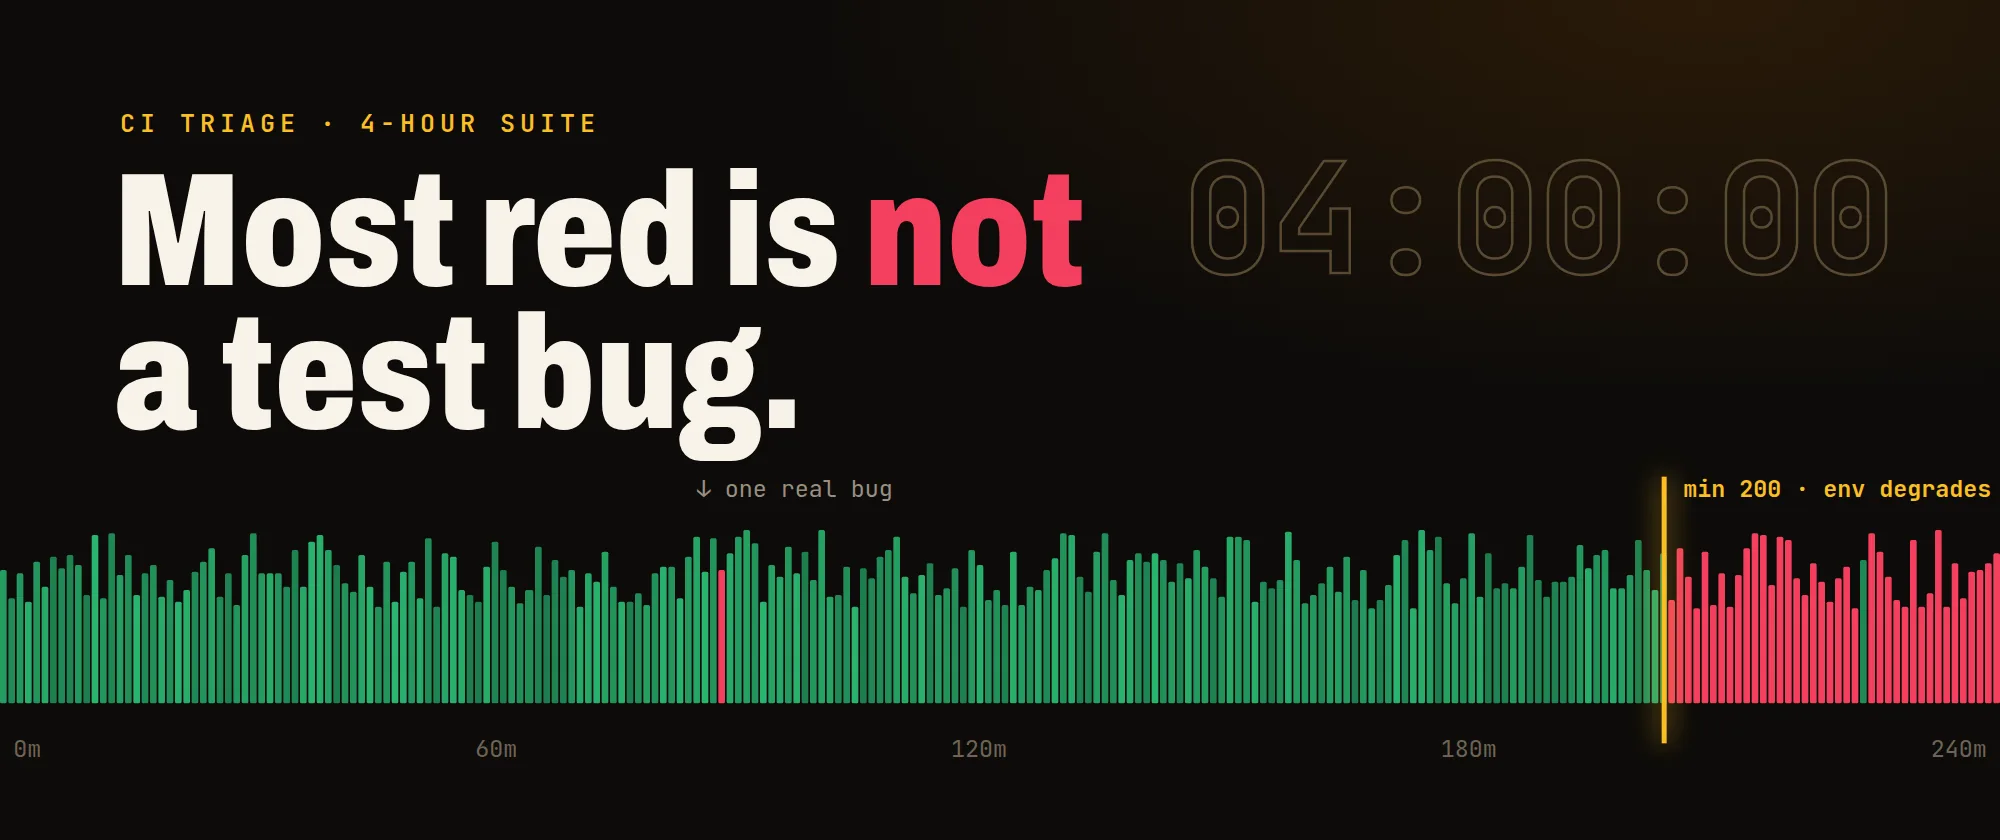
Four hours. Thousands of tests. And most red is not a test bug.
I maintain a suite in that range, and the most expensive mistake I can make there is debugging a test that was never wrong.
When a suite is small, triage is reading a stack trace. At this size it's a different job entirely. After enough runs you stop reading individual failures and start reading the shape of the failure set, so that's how I wrote down the triage I actually use: as failure fingerprints.
Fifteen seconds before any spec
Open the report and answer one question before you open a single spec: is the red correlated?
- Failures scattered across unrelated features, all at the same generic selector → environment.
- Failures clustered in one feature area → probably a real bug.
- Failures clustered in time (everything after minute 200) → environment degradation.
- One spec red in every run while everything around it is green → a real test or product bug, and the only case that deserves immediate spec-level debugging.
That's the whole question. It takes fifteen seconds and routes 90% of runs correctly. Here is what each shape looks like up close.
Six shapes of red 🔍
1. Mass identical failure at a loader or spinner
Thirty specs fail. All of them at something like #loading-spinner should not exist, or a login redirect, or an app shell that never renders. The specs have nothing in common except that they are authenticated.
This is the backend being dead, and it looks exactly like a broken shared selector. That ambiguity is the trap. Someone will "fix" the selector, and now you have two problems: a bad selector and a dead environment.
So how do you tell them apart in one look? Open the failing request's response body, not the screenshot:
- Dead application tier → an error payload, an HTML error page, a 502, or an empty body where JSON belongs.
- Genuinely renamed selector → a perfectly healthy response, and a rendered page that simply does not contain your element.
The screenshot is the least informative artifact in the bundle (it will happily show you a spinner and nothing else). The network log is the most. Until the response body says otherwise, mass identical failure at a shared selector is an environment signal, and nobody edits a selector on the basis of a screenshot.
The action is almost boring: restart the environment, re-run, and change nothing in the code. If the same thirty specs go green, the diff you were about to write was going to make things worse.
2. A lane that only fails at the tail of a long run
Now, here is where the plot thickens, one hour at a time. This is the pattern that took me longest to trust: one lane fails consistently, but only when it runs late. Run the same specs on their own and they are green. Every time.
That's not a test problem. That's the environment degrading over hours: connection pools, memory pressure, leaked sessions, accumulating locks, a licence server that starts refusing after N connections. Your tests are the canary, and you are about to spend a day debugging the canary.
The confirmation is cheap, so insist on it before anyone touches the code: re-run just that subset against a fresh environment. Green means degradation. Full stop.
The fix is often free. Move the lane so it runs first. Same total wall-clock, fresh backend, red disappears.
Is that cheating? It sure feels like it. It's not. Lane order is a scheduling decision you are already making implicitly, and leaving your most environment-sensitive work until hour four is a choice with no upside.
One honest caveat, though: reordering hides a real product weakness. Log it, tell the backend team what four hours of load does to their service, and keep the note. You have information they cannot easily get.
3. Red on the first attempt, green on retry, with a 5xx in the log
An unhandled server error on one endpoint. Intermittent, unreproducible locally. Retries paper over it, the suite reports green, and nobody ever looks.
I do two things here. First, make the failure legible: log the response body on failure, not just the status code. Second, make the request greppable in the server's own logs. Put a correlation value into the request that a backend engineer can search for (an epoch-millisecond token or a run id) and print it on failure.
const correlationId = Date.now()
cy.intercept('POST', '**/api/export', (req) => {
  req.body = { ...req.body, correlationId }
}).as('export')

cy.get('[data-cy="export"]').click()

cy.wait('@export').then(({ response }) => {
  if (response && response.statusCode >= 500) {
    cy.task('log', `export failed correlationId=${correlationId} body=${JSON.stringify(response.body)}`)
  }
})
Basically, the export request now carries a token the backend can grep for, and any 5xx prints it together with the body. One gotcha: do the logging after cy.wait, not inside the intercept handler. Cypress fails the test if a handler queues a command such as cy.task.
That's the difference between "the export sometimes 500s" and "the export 500'd at correlationId 1751022913004". One is a ticket that gets closed as not-reproducible. The other one gets fixed.
4. An empty state that never retries green
"No rows to show." "No data available." Retry, retry, retry. All red, several minutes gone.
An empty view almost always means a data fetch failed and the component swallowed the error into its empty state. Nothing about that is retriable, because the request is not coming back. Retries here are pure cost.
So detect it and short-circuit: reload once, assert properly, and if it's still empty, fail fast with a message that says data load failed rather than element not found. Your future self reading the report at 8am needs the report to distinguish "the app is broken" from "the test is wrong", and only you can make it do that.
5. State left behind by a killed run
Someone cancels a run mid-flight. From then on, specs fail with something like "this record is already being edited". Edited by whom? By you, in a session that no longer exists.
Server-side state keyed to a connection that died does not always get cleaned up. The instinct is to call the unlock API in a hook, and it often does not work, because the lock is not in the database. It lives in the web tier's in-memory state, for a connection that is gone. What clears it is establishing a genuinely new session: clear the cached session and perform a real login rather than restoring one.
The general lesson is more useful than the specific fix, though: cleanup hooks that call APIs cannot clear state that lives outside the API's reach. When a cleanup "does nothing", ask where the state actually lives before you make the cleanup more aggressive.
6. One spec, every run, everything around it green (finally, a real one)
Now you have earned the right to debug the spec. This is the minority case, and the only one where reading the stack trace first is correct. An intercept race and an import cycle that stops a spec file from loading both live here.
Five-minute triage starts in the report
Here's the catch: most teams cannot do any of the above, because their reports do not carry the signal. Four changes fix that, roughly in ROI order.
Group the failure summary by error message, not by spec. This is the single biggest one. "Twenty-eight failures, twenty-six of which share one error string" is a diagnosis rendered as a report. Twenty-eight separate spec entries is a reading assignment.
Per-spec start and end timestamps. Without them you cannot see the time-correlation in fingerprint 2, which means you will debug that lane repeatedly. For months.
The network log in every failure bundle, and make it the first thing you open. Screenshot, video, network. In that order of collection, and the reverse order of usefulness.
A one-line environment health check at the start of each lane, hitting a health endpoint and failing loudly with the response body. A lane that dies in ten seconds saying "environment unhealthy" is worth more than one that dies in forty minutes saying "element not found".
If you only do one of those, make it the first. Group your failure report by error message and everything above gets easier: thirty identical spinner failures collapse into one line you can read as "environment", and the one spec that really is broken stops hiding among them. Fifteen seconds to read the shape, five minutes to triage, and the only spec I open is the one that earned it.
What about you? What's the failure fingerprint your suite keeps leaving behind, the one you can now spot from the report alone? Tell me in the comments, I'd love to steal a seventh.